
More transactions do not automatically mean more people. A visual guide to reading digital adoption. A rising transaction count can describe several changes: more users, more purchases per user, or a shift from cash to digital payments. The line alone cannot tell us which explanation dominates.
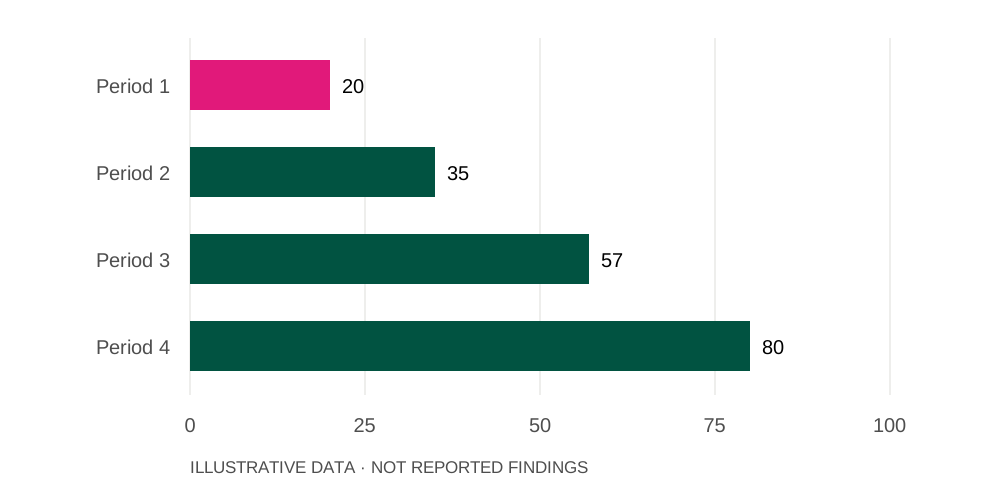
In this illustrative series,
80is the highest value, for Period 4.
In this illustrative series,
20is the lowest value, for Period 1.
Source: illustrative prototype dataset. Illustrative index.
What does a rise in payments tell us?
A rising transaction count can describe several changes: more users, more purchases per user, or a shift from cash to digital payments. The line alone cannot tell us which explanation dominates.
One payment index, four periods
Illustrative index
Source: Illustrative prototype dataset
How can we compare cities and towns?
Large cities and small towns have different populations and merchant networks. Per-person figures and the share of active users can offer a different perspective from total transaction volumes.
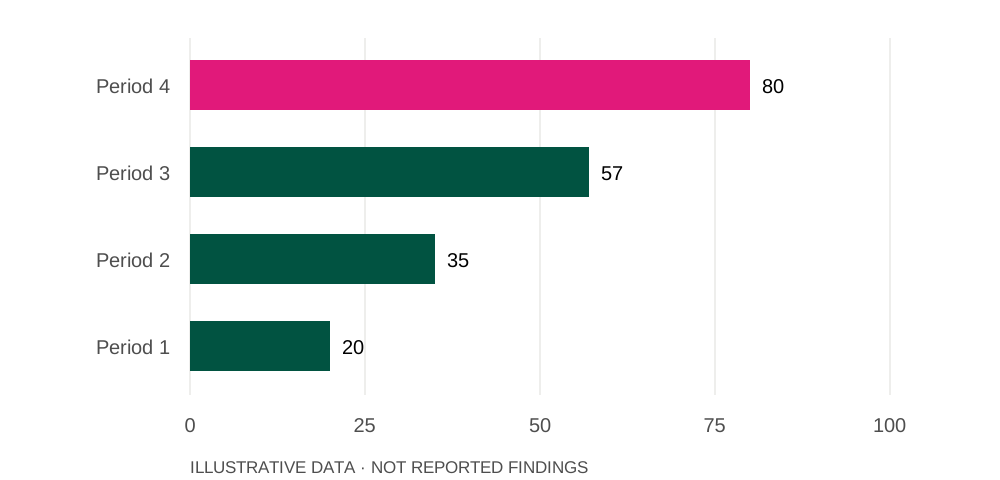
The same values, ordered from highest to lowest
Illustrative index
Source: Illustrative prototype dataset
Who might the data leave out?
Adoption is also about access and reliability. A fuller story would examine who can use the service, how frequently they use it and whether failed transactions or connectivity interrupt that experience.