
A destination count is a starting point. The richer story is about connections between places. Looking at destinations alone can conceal the places people move from. Origin-to-destination information helps reveal whether a city draws from nearby districts, from across a state or from a much wider area.
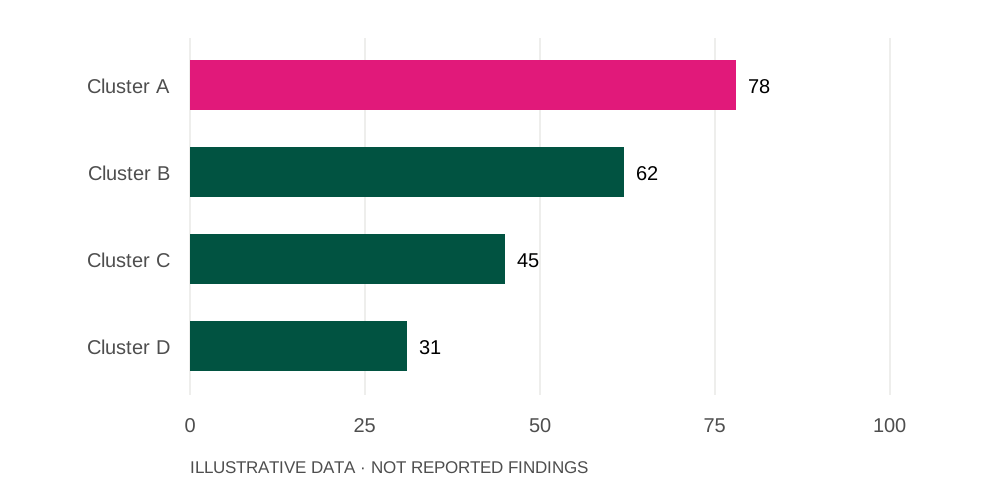
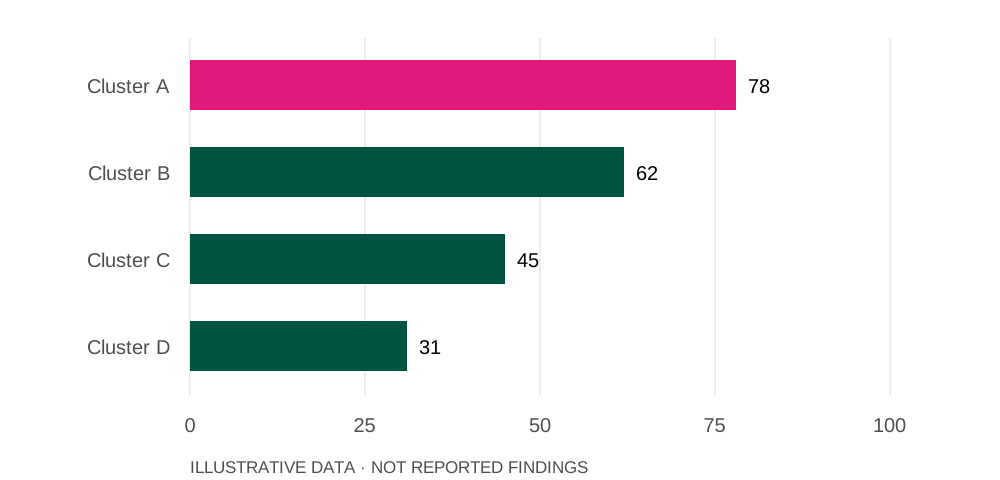
In this illustrative series,
78is the highest value, for Cluster A.
In this illustrative series,
31is the lowest value, for Cluster D.
Source: illustrative prototype dataset. Illustrative movement index.
What does a destination count show?
Looking at destinations alone can conceal the places people move from. Origin-to-destination information helps reveal whether a city draws from nearby districts, from across a state or from a much wider area.
Comparing four destination clusters
Illustrative movement index
Source: Illustrative prototype dataset
Why do people move?
A change of address does not by itself explain why someone moved. Work, education and family circumstances require their own evidence. A map of movement should not be mistaken for a survey of motives.
The same values, ordered from highest to lowest
Illustrative movement index
Source: Illustrative prototype dataset
Where does a city begin and end?
Municipal limits and wider metropolitan regions describe different populations. Consistent boundaries are essential before comparing one city with another or tracking change over time.