
An average can be mathematically correct and still miss the local experience. Rainfall makes that tension easy to see. Combining many places into one number removes variation. To understand local conditions, compare smaller areas and make the baseline explicit. An average is a summary, not a description of every place.
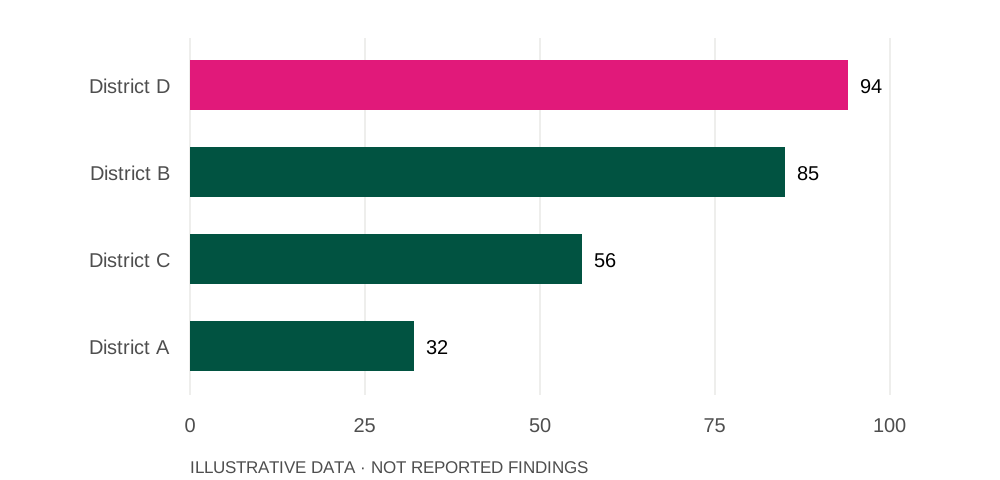
In this illustrative series,
94is the highest value, for District D.
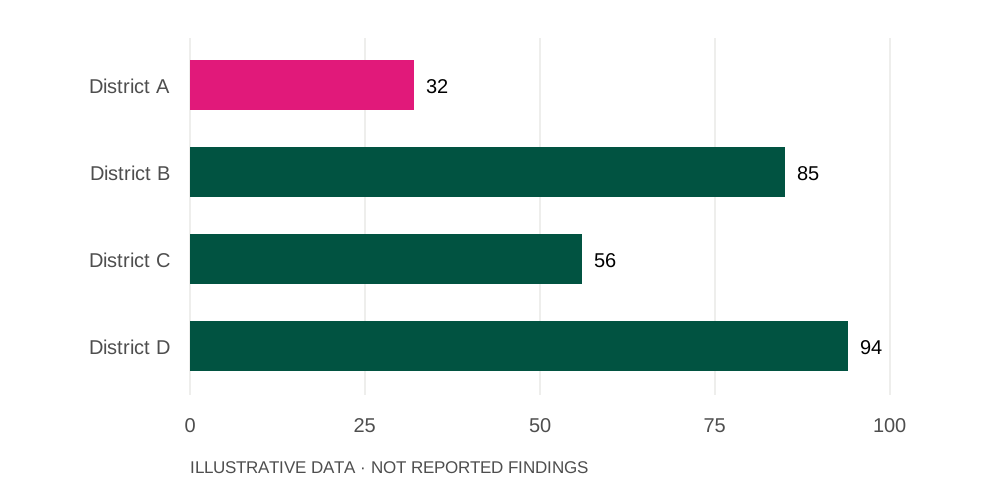
In this illustrative series,
32is the lowest value, for District A.
Source: illustrative prototype dataset. Illustrative rainfall index.
How does rainfall vary between places?
Combining many places into one number removes variation. To understand local conditions, compare smaller areas and make the baseline explicit. An average is a summary, not a description of every place.
Different places, different rainfall totals
Illustrative rainfall index
Source: Illustrative prototype dataset
Does rainfall timing matter?
A seasonal total does not tell us whether rain arrived steadily or in a few short bursts. Timing and intensity add context that a cumulative bar cannot show.
The same values, ordered from highest to lowest
Illustrative rainfall index
Source: Illustrative prototype dataset
How can we compare districts fairly?
A departure from normal depends on how normal is defined. Use a consistent reference period, check missing observations and distinguish measured rainfall from modelled estimates before comparing districts.