
A lower price can change a conversation. Understanding what that price includes is the next step. An auction bid, a generation-cost estimate and a consumer bill measure different things. A meaningful comparison specifies the unit, contract terms and costs included before it compares the headline figures.
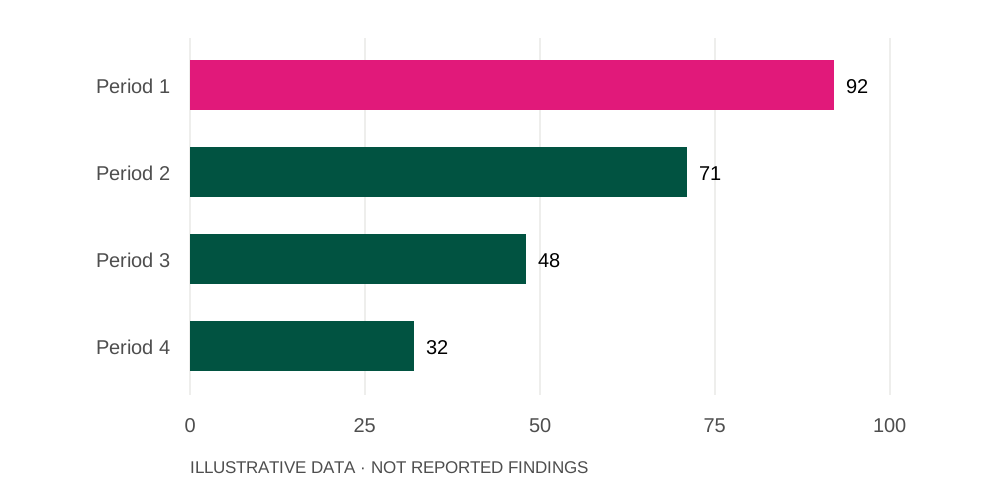
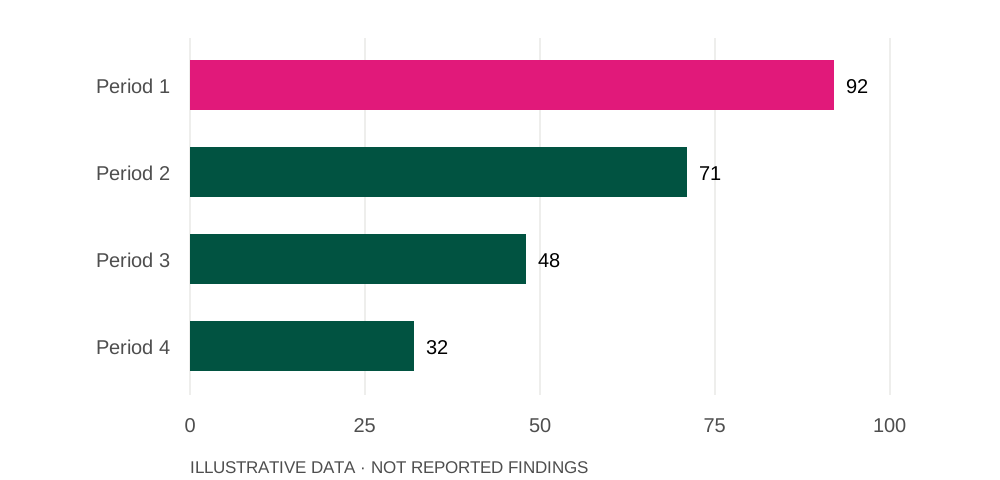
In this illustrative series,
92is the highest value, for Period 1.
In this illustrative series,
32is the lowest value, for Period 4.
Source: illustrative prototype dataset. Illustrative cost index; not tariff data.
Which electricity price are we comparing?
An auction bid, a generation-cost estimate and a consumer bill measure different things. A meaningful comparison specifies the unit, contract terms and costs included before it compares the headline figures.
An illustrative cost curve
Illustrative cost index; not tariff data
Source: Illustrative prototype dataset
Why do time and location matter?
A unit of electricity is not equally useful at every hour or location. Matching supply to demand introduces questions about transmission, storage and reliability that sit outside a simple cost curve.
The same values, ordered from highest to lowest
Illustrative cost index; not tariff data
Source: Illustrative prototype dataset
What does the full system cost?
A falling generation-cost index is one part of an energy story. A more complete assessment would pair it with the costs and performance of delivering electricity when and where people need it.