
Following connections between transport, industry and jobs—without mistaking a proposal for an outcome. A corridor is more than a collection of projects on a map. Its usefulness depends on how production centres, transport links and labour markets connect. A visual story should make those relationships legible.
In this illustrative series,
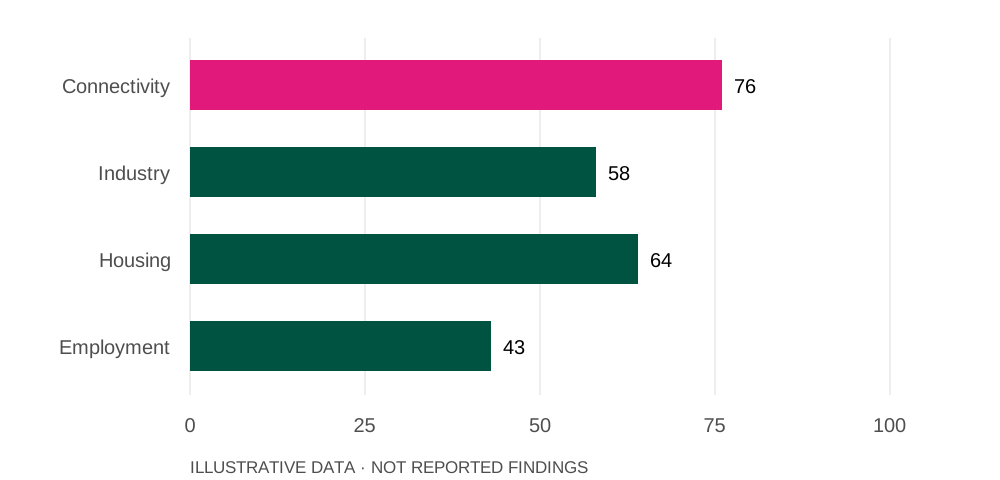
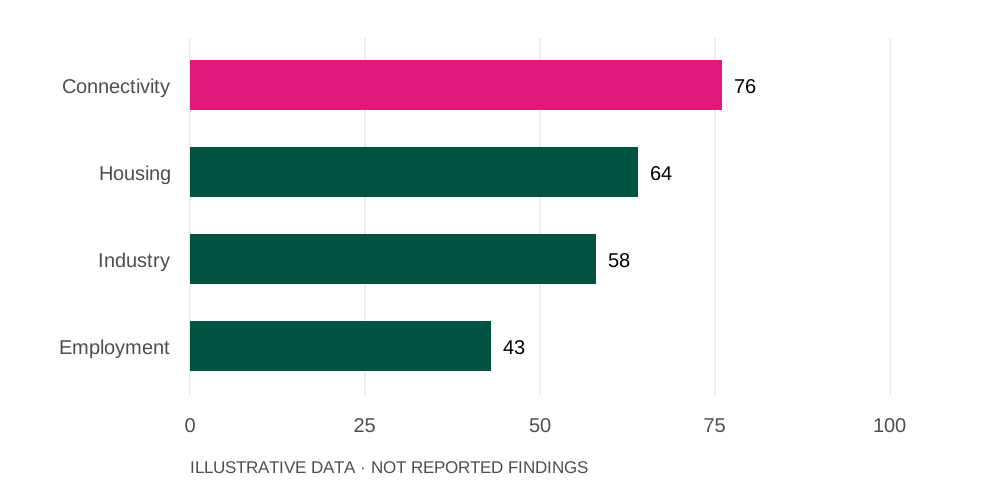
76is the highest value, for Connectivity.
In this illustrative series,
43is the lowest value, for Employment.
Source: illustrative prototype dataset. Illustrative index; not a location ranking.
How do connections shape a corridor?
A corridor is more than a collection of projects on a map. Its usefulness depends on how production centres, transport links and labour markets connect. A visual story should make those relationships legible.
A corridor through four lenses
Illustrative index; not a location ranking
Source: Illustrative prototype dataset
What is planned and what is operational?
Announced, under-construction and operational projects belong in separate categories. Combining them can make a place appear more developed than the evidence supports. Dates and status are part of the data.
The same values, ordered from highest to lowest
Illustrative index; not a location ranking
Source: Illustrative prototype dataset
How should we measure the outcomes?
Investment announcements are inputs. Employment, travel times and use of infrastructure are closer to outcomes. Comparing the two helps frame better questions about who benefits and when.